- DATE:
- AUTHOR:
- The Nedap Now Dairy Farming - Release notes team
Extended heat stress history
We've enhanced the Heat Stress module, providing you with deeper insights into heat stress patterns! The following three things were added:
Historical overview
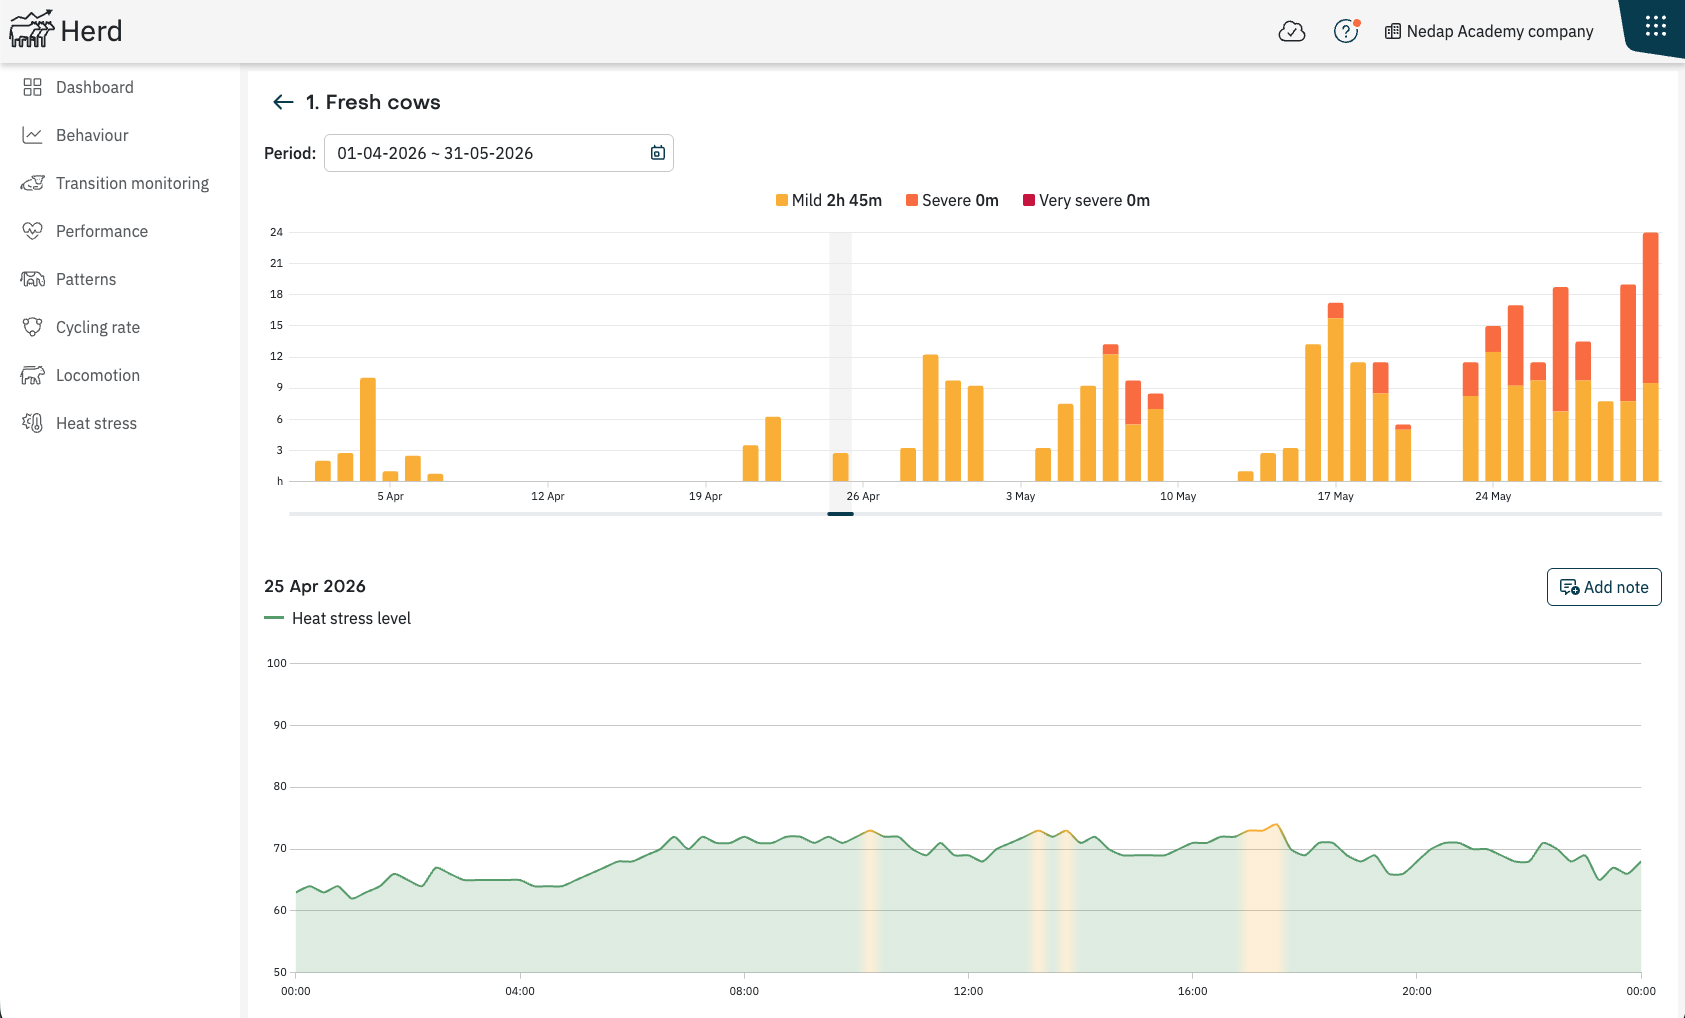
Gain a clear view of heat stress trends over time with a new historical overview chart. The bar chart shows the daily duration of Mild, Severe, and Very Severe heat stress levels, making it easy to identify patterns at a glance.
If you need more detail, you can zoom in on any day by clicking on the day in the chart area. The daily details of that day are then shown in the chart below. Daily details are available for the past 60 days, also for days without any recorded heat stress.
Daily chart available in the pen overview
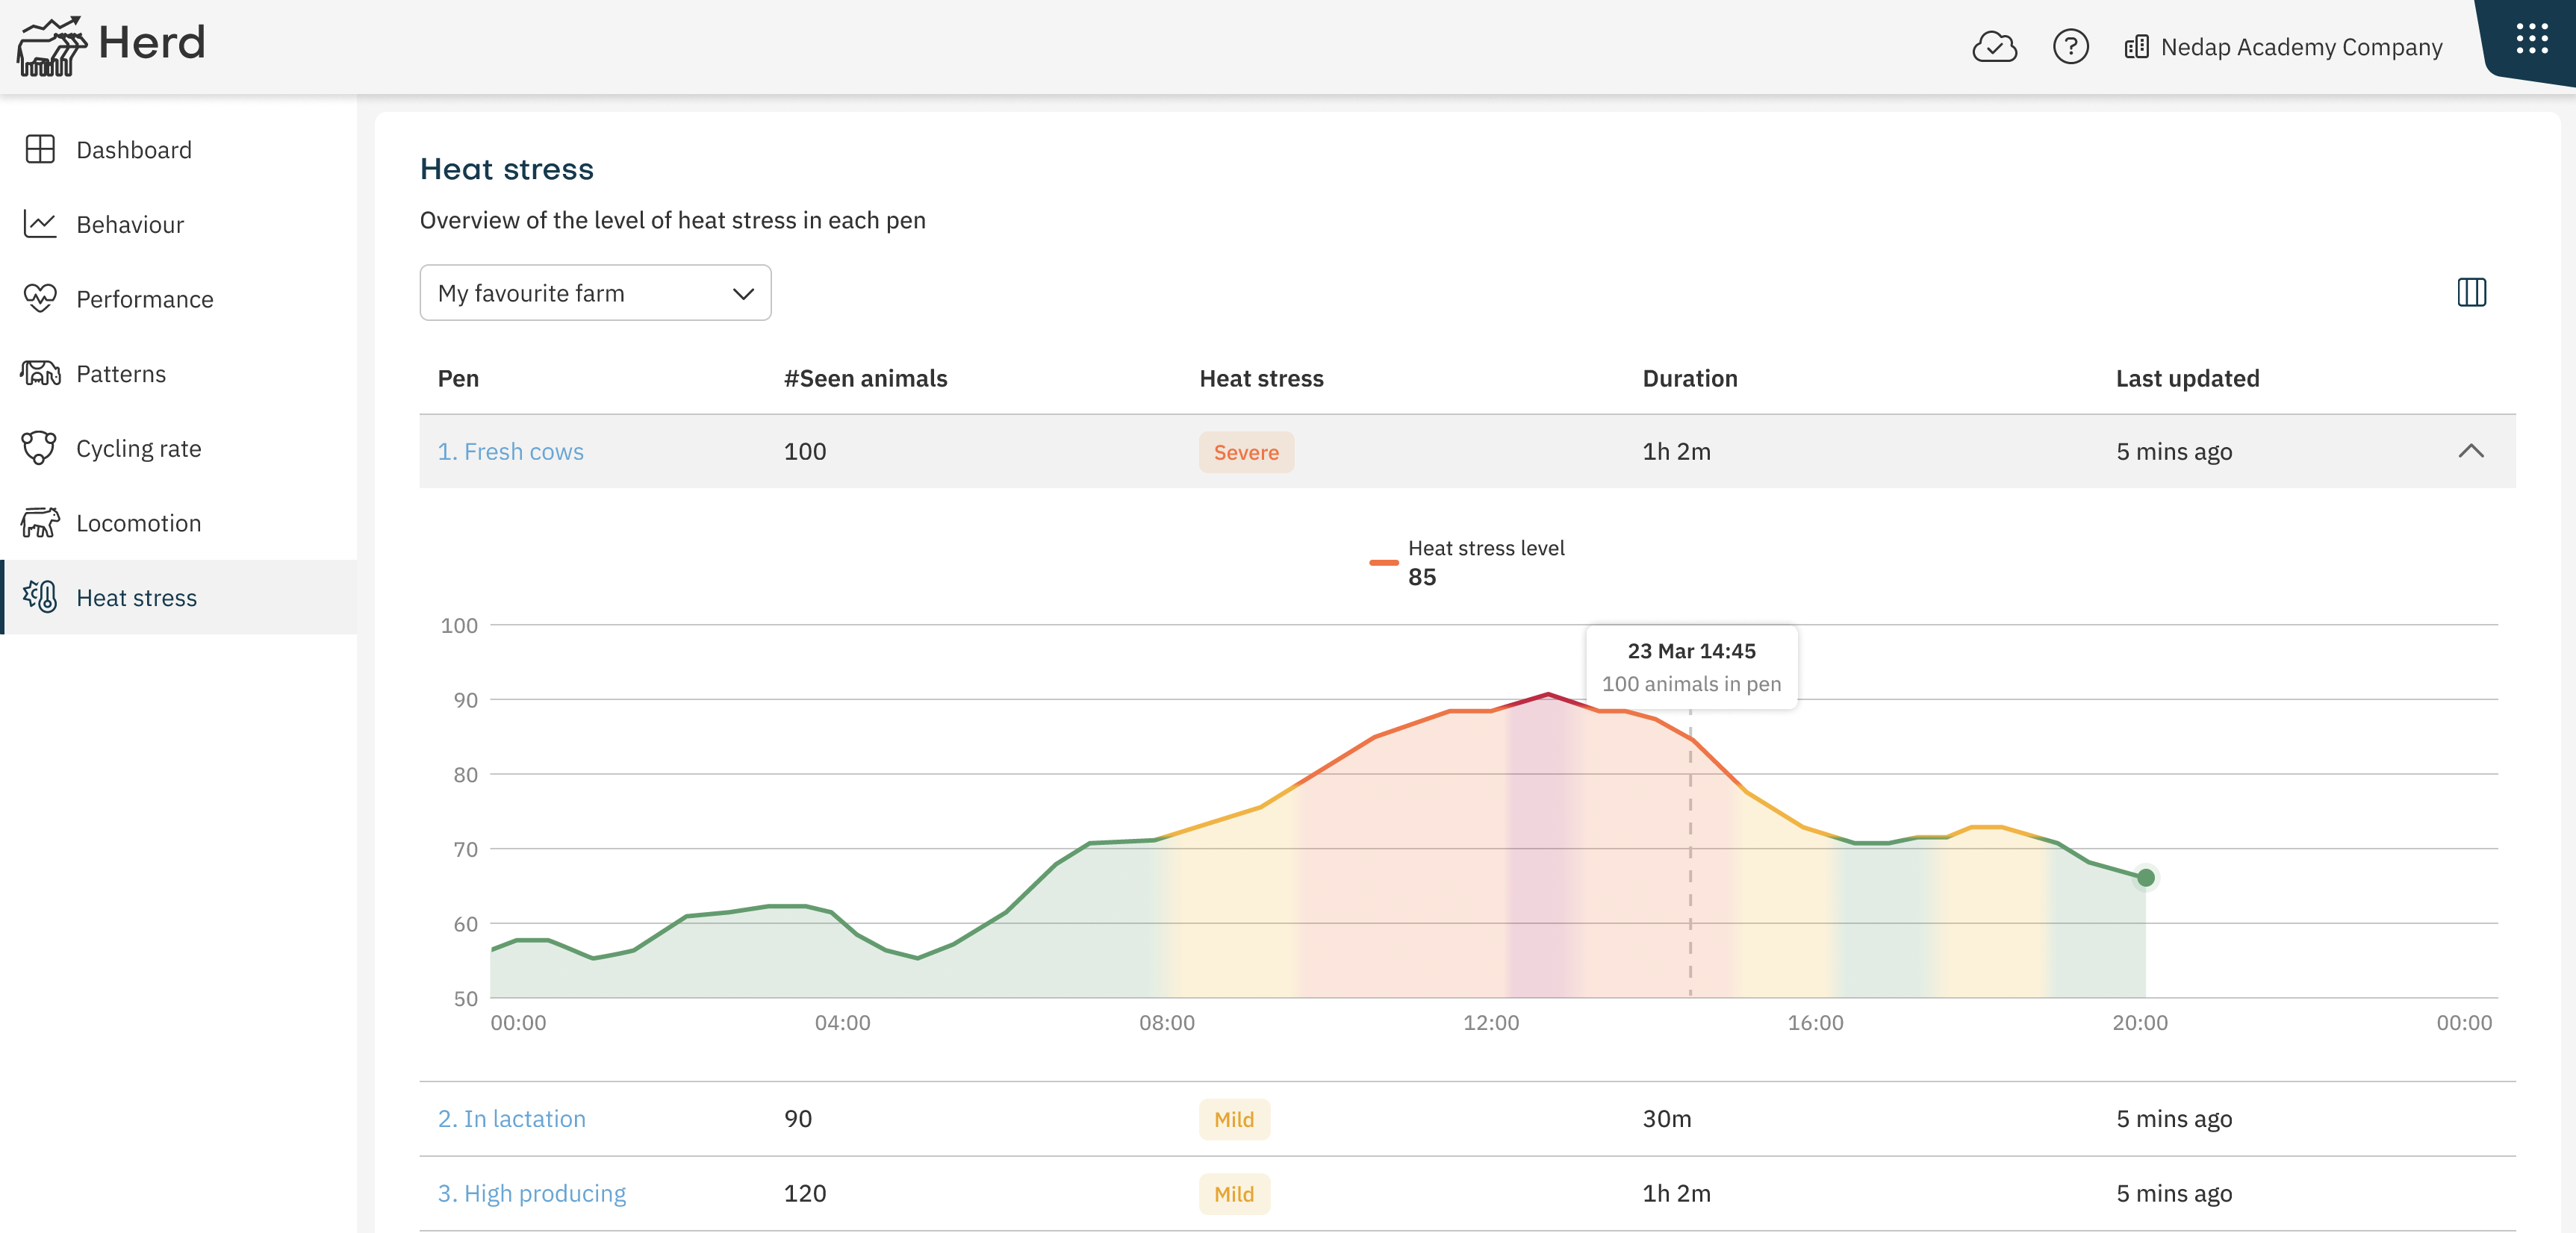
If you want a quick look on how your pens are doing, you can open the daily heat stress details directly from the pen overview. This allows you to quickly assess conditions across your pens without leaving the overview screen.
Renewed daily chart
The daily details chart has a new look to provide a more intuitive view of heat stress throughout the day. Instead of using shaded background areas to indicate heat stress levels, the line and the area beneath the line now change colour according to the heat stress level. This makes it easier to see not only that there was heat stress, but also when it started and ended.